Fig. 4
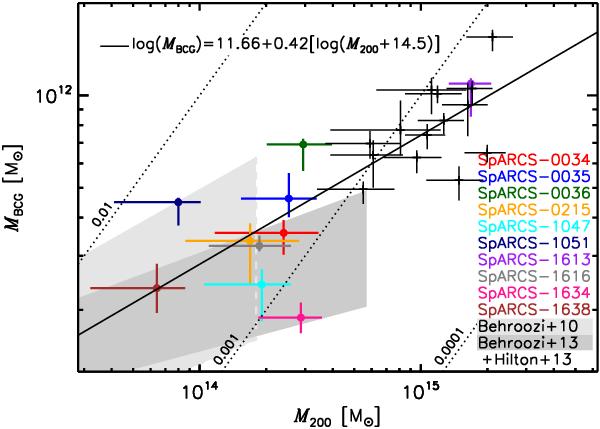
BCG stellar mass versus total halo mass. Black dots show lines of constant stellar mass fractions of 0.0001, 0.001 and 0.01. -signs show the results from Hilton et al. (2013). The relation is the best fit to the combined data set of Hilton et al. (2013) and the current study. Estimates from Behroozi et al. (2010) and Behroozi et al. (2013) are indicated by the shaded regions.
Current usage metrics show cumulative count of Article Views (full-text article views including HTML views, PDF and ePub downloads, according to the available data) and Abstracts Views on Vision4Press platform.
Data correspond to usage on the plateform after 2015. The current usage metrics is available 48-96 hours after online publication and is updated daily on week days.
Initial download of the metrics may take a while.