Fig. 5
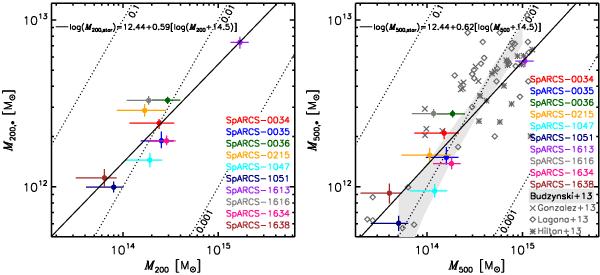
Total stellar mass versus halo mass within a sphere with radius R200 and R500 (left and right panels, respectively). Error bars represent uncertainties on individual mass measurements and uncertainties on the membership correction for galaxies we do not have spectra for. Dotted lines show locations with constant stellar mass fractions. The literature measurements (right panel) are measured over a range of redshifts, and are based on different analyses. When possible, the data points are corrected for differences in IMF and M⋆/L’s, as explained in the text.
Current usage metrics show cumulative count of Article Views (full-text article views including HTML views, PDF and ePub downloads, according to the available data) and Abstracts Views on Vision4Press platform.
Data correspond to usage on the plateform after 2015. The current usage metrics is available 48-96 hours after online publication and is updated daily on week days.
Initial download of the metrics may take a while.