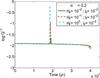
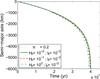
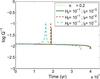
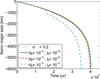
Fig. 4
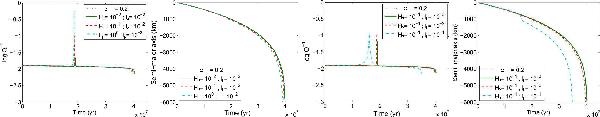
Evolution of the tidal dissipation and of the semi-major axis with time for different values of lp and Hp, the width at half-height and the height of the studied single resonant damping peak. The grey dotted line corresponding to α = 0.2 is superposed to the continuous green one except at the position of the peak for Q-1.
Current usage metrics show cumulative count of Article Views (full-text article views including HTML views, PDF and ePub downloads, according to the available data) and Abstracts Views on Vision4Press platform.
Data correspond to usage on the plateform after 2015. The current usage metrics is available 48-96 hours after online publication and is updated daily on week days.
Initial download of the metrics may take a while.