Fig. 4
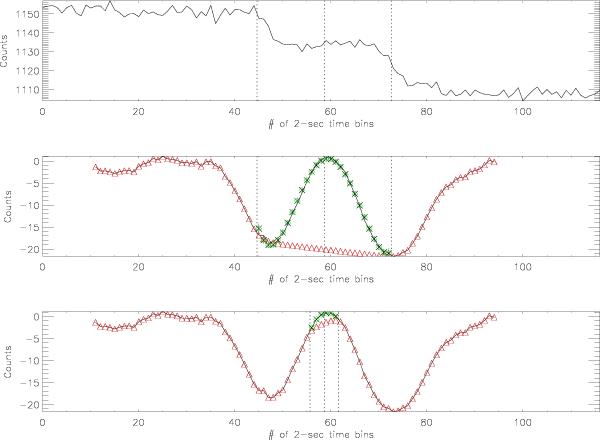
Top: averaged window for 10 days for a virtual source near the Crab. Crab steps are at bins ~47and ~72. Middle: filtered data with the central portion fit to a polynomial (green), and the outer background portion fit to a spline function (red). Large dips from Crab steps result in negative amplitude for the virtual source. Bottom: filtered data refit with central portion only ± fa instead of the normal ± (2fa + fb).
Current usage metrics show cumulative count of Article Views (full-text article views including HTML views, PDF and ePub downloads, according to the available data) and Abstracts Views on Vision4Press platform.
Data correspond to usage on the plateform after 2015. The current usage metrics is available 48-96 hours after online publication and is updated daily on week days.
Initial download of the metrics may take a while.