Fig. 1
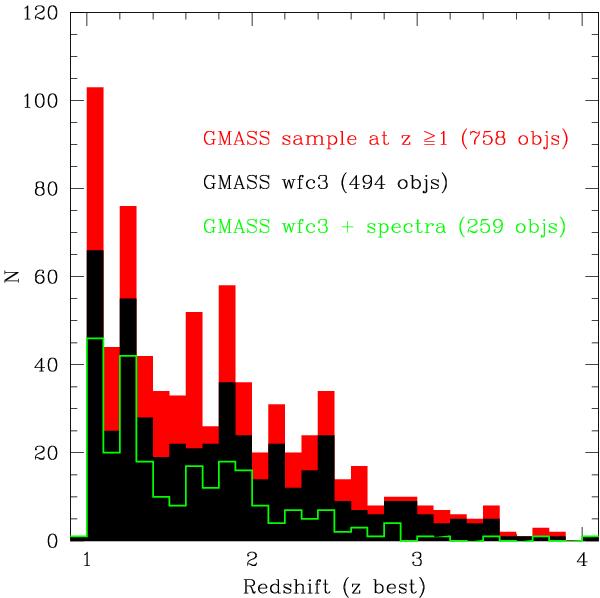
Redshift distribution. The red histogram represents best-redshift (spectroscopic or photometric) distribution of the total GMASS sample at z ≥ 1; the black histogram represents best-redshift distribution of the 494 galaxies from the GMASS-WFC3 sample; the green histogram represents the distribution for the 259 galaxies with a spectroscopic redshift.
Current usage metrics show cumulative count of Article Views (full-text article views including HTML views, PDF and ePub downloads, according to the available data) and Abstracts Views on Vision4Press platform.
Data correspond to usage on the plateform after 2015. The current usage metrics is available 48-96 hours after online publication and is updated daily on week days.
Initial download of the metrics may take a while.