Fig. 13
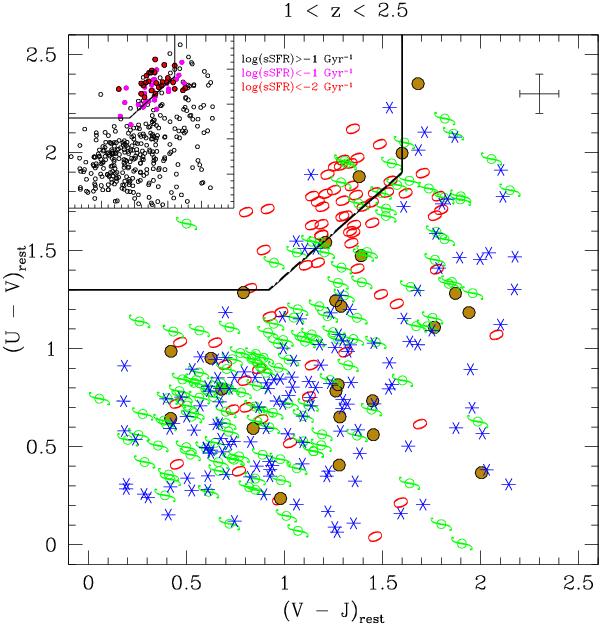
Rest-frame U − V vs. V − J colours for galaxies at 1 < z < 2.5 in our sample. In the big plot, points are shape and colour coded with respect to the morphological visual class (see Fig. 3). In the small insert, points are colour coded with respect to their sSFR. In both plots, the “quiescent” region, defined by Williams et al. (2009) for the chosen redshift range, is also marked.
Current usage metrics show cumulative count of Article Views (full-text article views including HTML views, PDF and ePub downloads, according to the available data) and Abstracts Views on Vision4Press platform.
Data correspond to usage on the plateform after 2015. The current usage metrics is available 48-96 hours after online publication and is updated daily on week days.
Initial download of the metrics may take a while.