Fig. 3
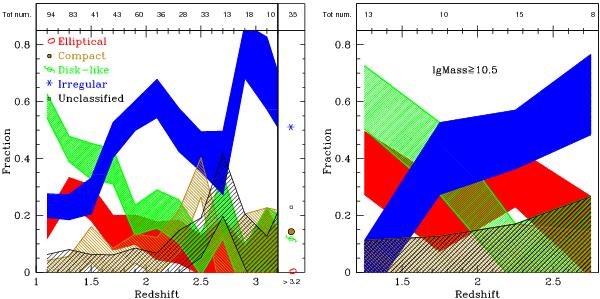
Left plot: the relative fractions of the different galaxy morphological types as a function of redshift. The total number of galaxies in each redshift step (Δz = 0.2) between z = 1 and z = 3.2 is indicated. The last step includes all galaxies at z > 3.2. The confidence regions reflect both the random uncertainty and the differences between classifications made by three different authors. See the text for more details about the classification procedure. Right plot: same as left, but for a mass complete sample (log (M⊙ lim) = 10.5). In this plot the redshift step is Δz = 0.5.
Current usage metrics show cumulative count of Article Views (full-text article views including HTML views, PDF and ePub downloads, according to the available data) and Abstracts Views on Vision4Press platform.
Data correspond to usage on the plateform after 2015. The current usage metrics is available 48-96 hours after online publication and is updated daily on week days.
Initial download of the metrics may take a while.