Fig. 4
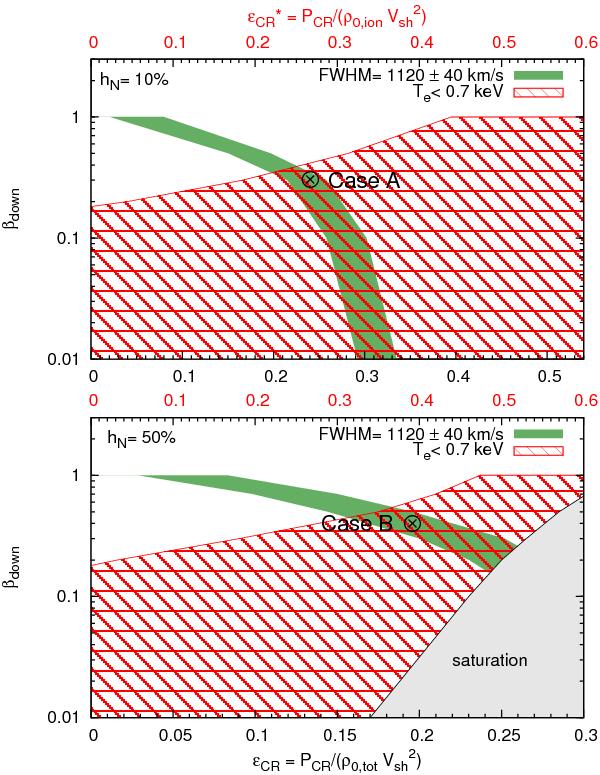
Allowed regions of the parameter space βdown-ϵCR using different constraints. The allowed parameter space is given by the intersection of the green shaded area (constrained by the measured FWHM) and the hatched region (constrained by the upper limit on the electron temperature). The top and bottom panels refer to hN = 10% and hN = 50%, respectively. The values of the parameters are the same as in Fig. 3. In the lower panel the dashed gray region shows the saturation region. The crosses labeled Case A and Case B refer to the cases analyzed in Figs. 5 and 6 (see text for explanation).
Current usage metrics show cumulative count of Article Views (full-text article views including HTML views, PDF and ePub downloads, according to the available data) and Abstracts Views on Vision4Press platform.
Data correspond to usage on the plateform after 2015. The current usage metrics is available 48-96 hours after online publication and is updated daily on week days.
Initial download of the metrics may take a while.