Fig. 1
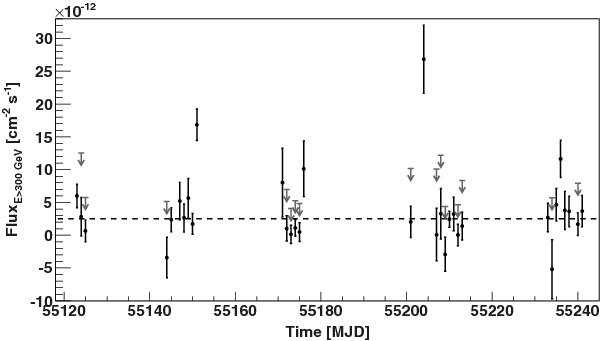
Light curve of IC 310 above 300 GeV from 2009 October to 2010 February. The arrows are 95% confidence level upper limits calculated for days compatible with no signal. The dashed line shows the constant flux fit to all flux points not taking the upper limits (χ2/d.o.f. = 102/32) into account.
Current usage metrics show cumulative count of Article Views (full-text article views including HTML views, PDF and ePub downloads, according to the available data) and Abstracts Views on Vision4Press platform.
Data correspond to usage on the plateform after 2015. The current usage metrics is available 48-96 hours after online publication and is updated daily on week days.
Initial download of the metrics may take a while.