Fig. 1
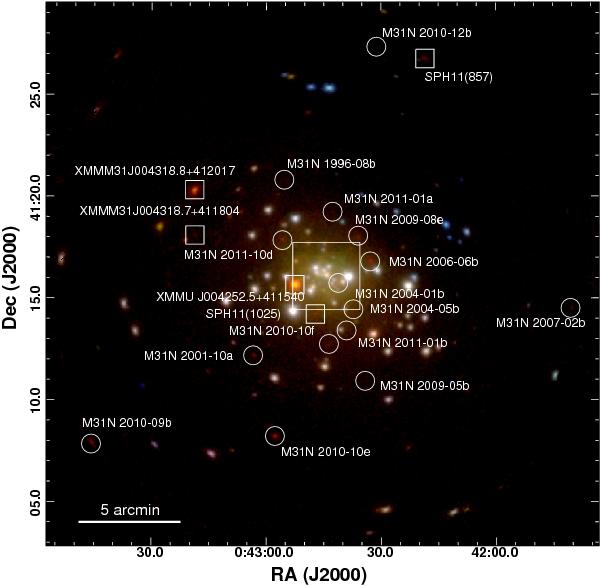
Logarithmically scaled, three colour XMM-Newton EPIC image of the central area of M 31 combining pn, MOS1, and MOS2 data for all 15 observations from Table 1. Red, green, and blue show the (0.2–0.5) keV, (0.5–1.0) keV and (1.0–2.0) keV bands. Supersoft X-ray sources show up in red. The data in each colour band were binned in 2′′ × 2′′pixels and smoothed using a Gaussian of FWHM 5′′. The counterparts of optical novae detected in the outer regions of the fields, but not necessarily visible in this image, are marked with white circles. The non-nova SSSs detected in this work are marked by white boxes with SPH11(no.) referring to the source numbers in the catalogue of Stiele et al. (2011). The innermost  of M 31, as indicated by the large white box, suffer from source confusion in the XMM-Newton data and the novae in this area are shown in a Chandra composite in Fig. 2.
Current usage metrics show cumulative count of Article Views (full-text article views including HTML views, PDF and ePub downloads, according to the available data) and Abstracts Views on Vision4Press platform.
Data correspond to usage on the plateform after 2015. The current usage metrics is available 48-96 hours after online publication and is updated daily on week days.
Initial download of the metrics may take a while.