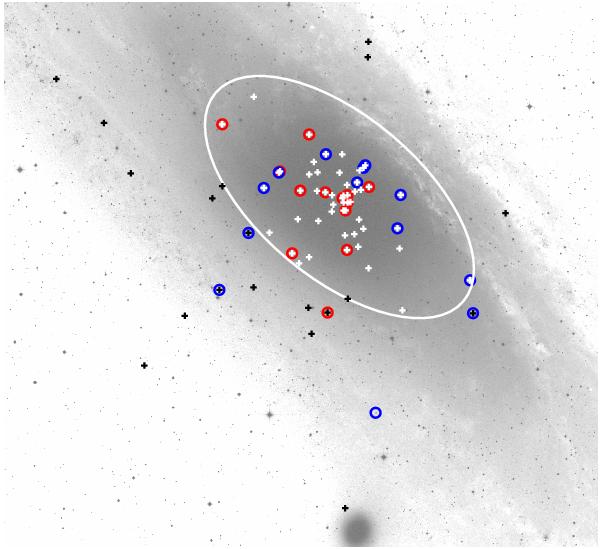
Fig. 10

Cut-out of M 31 image (from DSS2-R) overlaid with positions of bulge (white) and disk novae (black), where the large ellipse separates both populations (see Sect. 5.3). Circles mark novae with high-mass (blue) and low-mass (red) WDs, which were classified according to their SSS ton times. See Sect. 5.3 for the classification methods. Only four objects from Table 9 are outside this image. North is up and east is to the left.
Current usage metrics show cumulative count of Article Views (full-text article views including HTML views, PDF and ePub downloads, according to the available data) and Abstracts Views on Vision4Press platform.
Data correspond to usage on the plateform after 2015. The current usage metrics is available 48-96 hours after online publication and is updated daily on week days.
Initial download of the metrics may take a while.


