Fig. 12
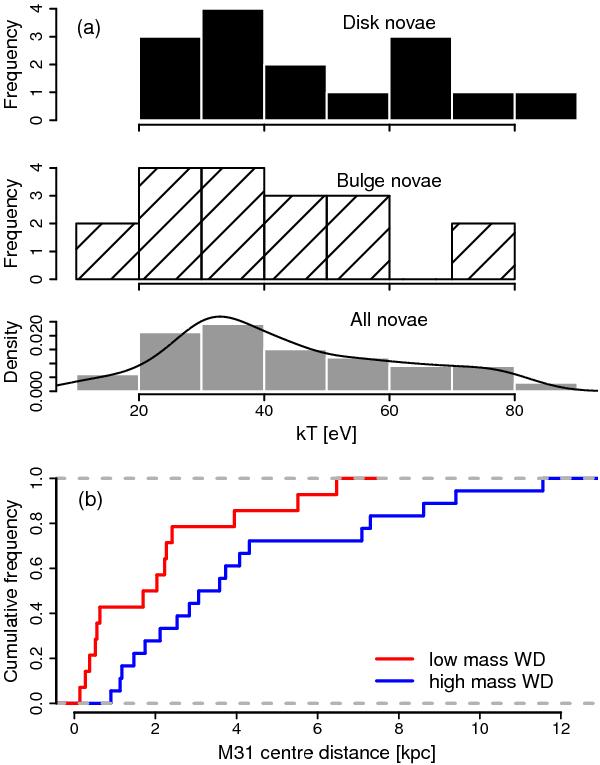
Panel a) distribution of effective (black body) temperature kT for disk novae (shaded/upper plot), bulge novae (black/middle plot), and the total sample (grey/lower plot), respectively. The upper two plots show frequencies and the lower one shows densities with an overlaid smooth density curve. b) Empirical cumulative density distribution functions of the inclination-corrected M 31-centric distances for novae with high mass (blue) and low mass (red) WDs. Distances are given in kpc, assuming a distance to M 31 of 780 kpc and are not corrected for projection effects.
Current usage metrics show cumulative count of Article Views (full-text article views including HTML views, PDF and ePub downloads, according to the available data) and Abstracts Views on Vision4Press platform.
Data correspond to usage on the plateform after 2015. The current usage metrics is available 48-96 hours after online publication and is updated daily on week days.
Initial download of the metrics may take a while.