Free Access
Fig. 13
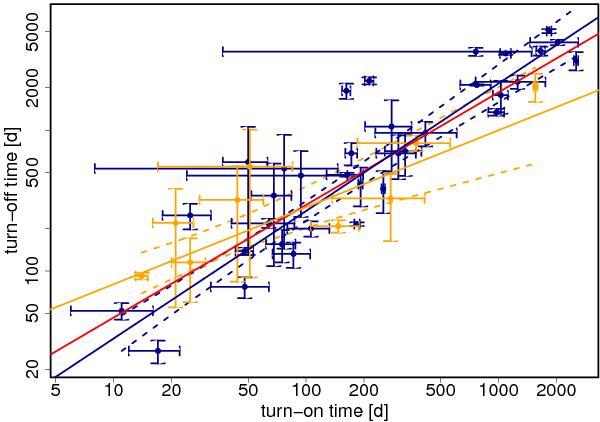
Same as Fig. 8a, with different colours of symbols and best-fit lines for bulge (dark blue) and disk novae (orange). The two GC novae M31N 2007-06b and M31N 2010-10f have been excluded from this analysis. The dashed lines show the 95% confidence limits associated with the fits. The overall best fit is shown in red.
Current usage metrics show cumulative count of Article Views (full-text article views including HTML views, PDF and ePub downloads, according to the available data) and Abstracts Views on Vision4Press platform.
Data correspond to usage on the plateform after 2015. The current usage metrics is available 48-96 hours after online publication and is updated daily on week days.
Initial download of the metrics may take a while.