Fig. 6
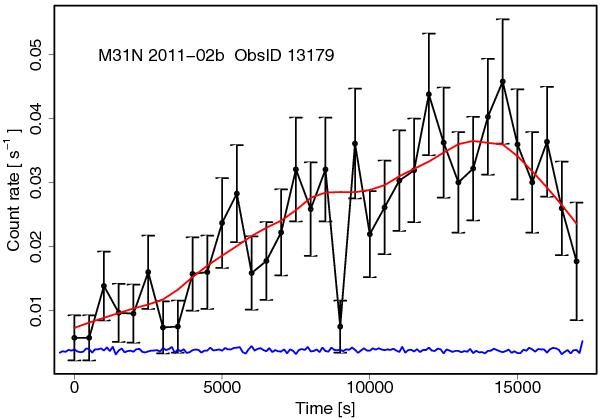
Chandra HRC-I light curve of nova M31N 2011-02b during observation 13179. The time is measured from the beginning of the exposure at UT 2011-02-27.25 UT and binned in 500 s intervals. The red curve is a smoothed fit to the light curve. In blue, we show the background light curve in arbitrary scaling to illustrate the stability of the background count rate.
Current usage metrics show cumulative count of Article Views (full-text article views including HTML views, PDF and ePub downloads, according to the available data) and Abstracts Views on Vision4Press platform.
Data correspond to usage on the plateform after 2015. The current usage metrics is available 48-96 hours after online publication and is updated daily on week days.
Initial download of the metrics may take a while.