Fig. 7
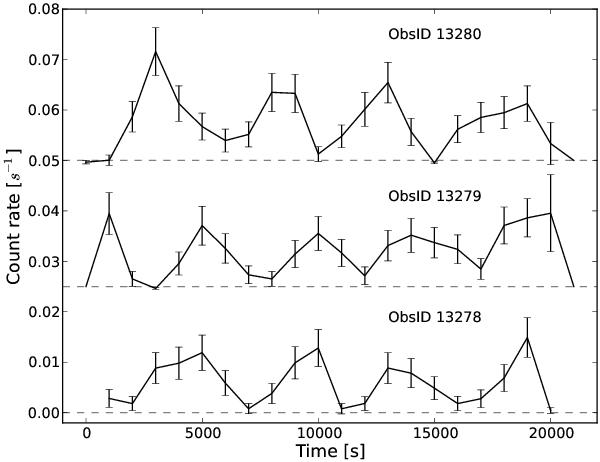
Chandra HRC-I light curves of nova M31N 2011-11e during the three Chandra observations where it was detected. The time is measured from the beginning of each exposure at UT 2012-02-17.76 (ObsID 13278), 2012-02-28.26 (13279) and 2012-03-13.21 (13280). The upper two light curves include a count rate offset (see dashed grey lines) for better readability.
Current usage metrics show cumulative count of Article Views (full-text article views including HTML views, PDF and ePub downloads, according to the available data) and Abstracts Views on Vision4Press platform.
Data correspond to usage on the plateform after 2015. The current usage metrics is available 48-96 hours after online publication and is updated daily on week days.
Initial download of the metrics may take a while.