Fig. 8
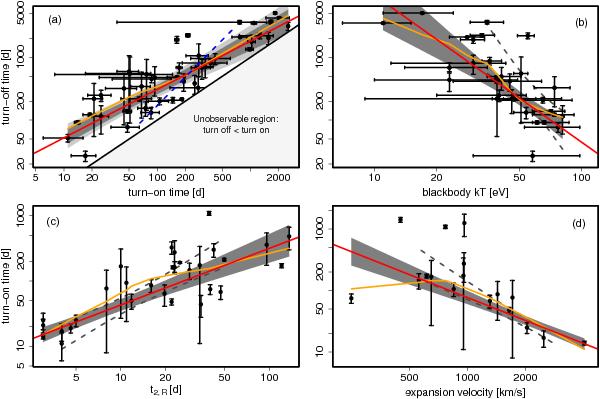
Double-logarithmic plots of the updated correlations from Paper II. Data points and error bars are shown with a smooth fit (orange) for visualising, as well as a robust power law fit (red) with corresponding 95% confidence regions (dark grey) for modelling. The correlations displayed are: a) turn-on time versus turn-off time, b) black body temperature (kT) in eV versus turn-off time, c) optical decay time t2,R versus turn-on time, and d) expansion velocity in km s-1 versus turn-on time. All time scales are given in units of days after outburst. In panel a), the light-grey shaded area around the best fit shows the 99.9% confidence region; the blue dashed line indicates the relation found by Hachisu & Kato (2010) for Galactic novae (see Sect. 5.2.2, and the lightly shaded area in the lower left corner visualises the “unobservable region” where the turn-off time occurs before the turn-on time. In panels b)–d), the grey dashed lines indicate the 95% confidence regions from Paper II, which are based on an earlier version of the catalogue. For panel a), we did not include these lines to avoid confusion and because there mainly is an improvement in accuracy but no change of slope.
Current usage metrics show cumulative count of Article Views (full-text article views including HTML views, PDF and ePub downloads, according to the available data) and Abstracts Views on Vision4Press platform.
Data correspond to usage on the plateform after 2015. The current usage metrics is available 48-96 hours after online publication and is updated daily on week days.
Initial download of the metrics may take a while.