Fig. 1
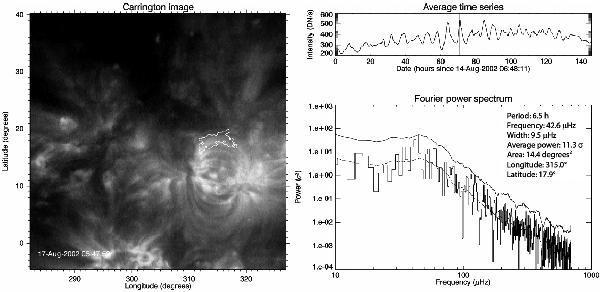
Summary of an event detection in the region of interest tracked starting on August 14, 2002 06:48:11 UT and ending on August 20, 2002 08:36:10 UT. Left: intermediate frame of the heliographic coordinates movie. The white contour delimits the detected event. Top right: light curve averaged over the contoured area. The vertical bar marks the date of the frame in the left panel. Bottom right: Fourier power spectrum of the light curve. The dashed line is the estimate of the background power. The solid line is the 10 σ detection threshold. The temporal evolution is available in the online movie.
Current usage metrics show cumulative count of Article Views (full-text article views including HTML views, PDF and ePub downloads, according to the available data) and Abstracts Views on Vision4Press platform.
Data correspond to usage on the plateform after 2015. The current usage metrics is available 48-96 hours after online publication and is updated daily on week days.
Initial download of the metrics may take a while.