Fig. 4
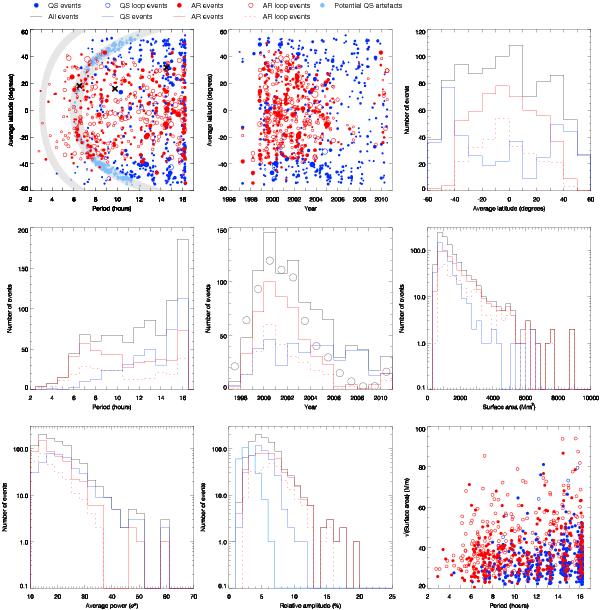
Summary of the main properties of the detected events. Top left: latitude of the events vs. their period. In this representation, artefacts can occur in the two shaded regions (see Appendix A and Fig. A.1). Quiet Sun (QS) events clustered in these regions (in light blue) are potential artefacts and are excluded in the subsequent plots. Other QS events are denoted by blue circles, and active region (AR) events by red circles. Open circles correspond to events associated with loops. The area of the circles is proportional to the heliographic area of the events. From left to right, the black crosses mark the events illustrated in Figs. 1–3, respectively. Top center: latitude vs. date. QS and AR events outline mutually exclusive areas and the AR events draw a butterfly-type pattern. Top right: number of events as a function of latitude. The global distribution (black) is rather flat and results from the opposite behavior of QS and AR events. Center left: histograms of periods. if one considers all events (black curve), the longer the period, the more numerous the detections, with a plateau between 7 and 14 h. AR events (red) dominate the short periods, and after a hump around 7 h the distribution is flat. AR events associated with loops have the same behavior. QS events (blue) become more frequent with increasing periods. Center: number of events per year. The number of QS events is about constant while the number of AR events closely follows the Yearly Sunspot Number (gray circles). Center right: histograms of areas, in log scale. QS and AR events follow exponential distributions, with AR events tending to be larger. Bottom left: histograms of the power of events. All types of events roughly follow exponential distributions of similar slopes. Bottom center: histograms of amplitudes relative to average light curve intensities. AR events (solid and dashed red) tend to have larger amplitudes than QS events (blue). The smaller amplitudes of the potential artefacts identified in the top left panel (light blue histogram) clearly set them apart from other events. Bottom right: square root of the events area vs. their period. No correlation is apparent, but there is a region of exclusion: events with short periods tend to have smaller areas.
Current usage metrics show cumulative count of Article Views (full-text article views including HTML views, PDF and ePub downloads, according to the available data) and Abstracts Views on Vision4Press platform.
Data correspond to usage on the plateform after 2015. The current usage metrics is available 48-96 hours after online publication and is updated daily on week days.
Initial download of the metrics may take a while.