Fig. A.1
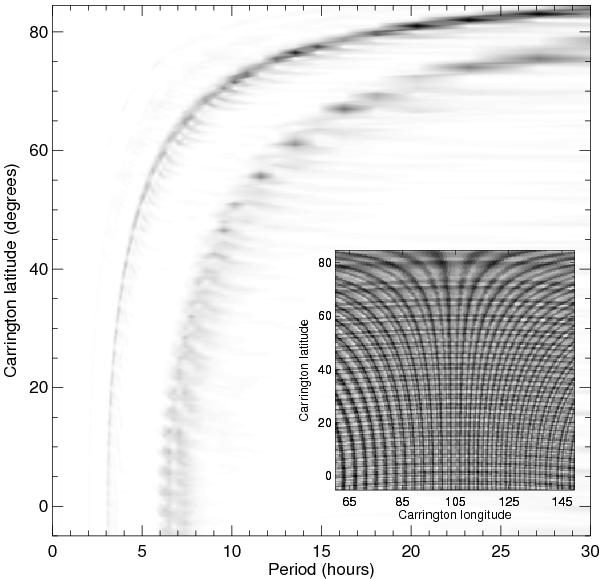
Results of the simulation consisting of images containing only the EIT grid pattern. The main image shows Fourier power spectra for points in the middle of the ROI. Darker shades of gray represent larger powers. An example of a simulated image is shown in the inset (lower-right corner).
Current usage metrics show cumulative count of Article Views (full-text article views including HTML views, PDF and ePub downloads, according to the available data) and Abstracts Views on Vision4Press platform.
Data correspond to usage on the plateform after 2015. The current usage metrics is available 48-96 hours after online publication and is updated daily on week days.
Initial download of the metrics may take a while.