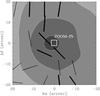
Fig. 4

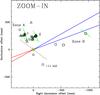
Left panel: modified version of Fig. 3(b) of Shinnaga et al. (2012). The white box indicates the position of the right panel. The black bars represent the magnetic field direction determined from the polarized dust emission at 350 μm, whose continuum emission is in the background. Right panel: CH3OH (triangles), OH (squares) (Edris et al. 2005), and H2O (octagons) masers in IRAS 20126+4104. The gold asterisk represents the B0.5 protostar ( and
and  , MCR11), while the dotted line represents the Keplerian disk of ~1000 au (PAdisk = 53° ± 7°, Cesaroni et al. 2005). The red and blue lines indicate the red- and blue-shifted lobes of the jet, respectively, with a PAjet = 115° and an opening angle of 9° (MCR11). The thick green segments represent the magnetic field direction determined from the polarized CH3OH and H2O maser emissions. The green dashed segments represent the magnetic field direction determined from the linearly polarized emission of OH masers (Edris et al. 2005). The foreground Faraday rotation at 1.6-GHz is probably not negligible and needs to be taken into account when interpreting the image (see Sect. 5.2).
Current usage metrics show cumulative count of Article Views (full-text article views including HTML views, PDF and ePub downloads, according to the available data) and Abstracts Views on Vision4Press platform.
Data correspond to usage on the plateform after 2015. The current usage metrics is available 48-96 hours after online publication and is updated daily on week days.
Initial download of the metrics may take a while.