Fig. 11
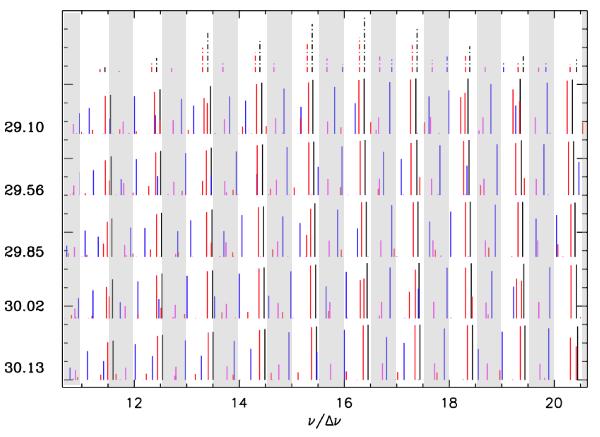
Top: frequency spectrum corresponding to the observed modes
(dashed lines). All other spectra (solid lines) are based on theoretical models
along a 1.5 M⊙ evolution sequence with
large separations Δν around the observed value. Theoretical
frequencies have been decreased by a constant factor to improve visual comparison.
Different colours correspond to different degrees as in Fig. 6: ℓ = 0 (black), ℓ = 1 (blue),
ℓ = 2
(red), and ℓ = 3 (pink). The amplitudes of the theoretical
modes have been scaled to 1/ relative to the radial modes except for the ℓ = 3 modes, which in
addition contain a 0.3
factor (to improve the visibility). The numbers on the left are the values of the
large separation Δν in μHz. Grey shaded
regions are done to guide the eye.
relative to the radial modes except for the ℓ = 3 modes, which in
addition contain a 0.3
factor (to improve the visibility). The numbers on the left are the values of the
large separation Δν in μHz. Grey shaded
regions are done to guide the eye.
Current usage metrics show cumulative count of Article Views (full-text article views including HTML views, PDF and ePub downloads, according to the available data) and Abstracts Views on Vision4Press platform.
Data correspond to usage on the plateform after 2015. The current usage metrics is available 48-96 hours after online publication and is updated daily on week days.
Initial download of the metrics may take a while.