Fig. 2
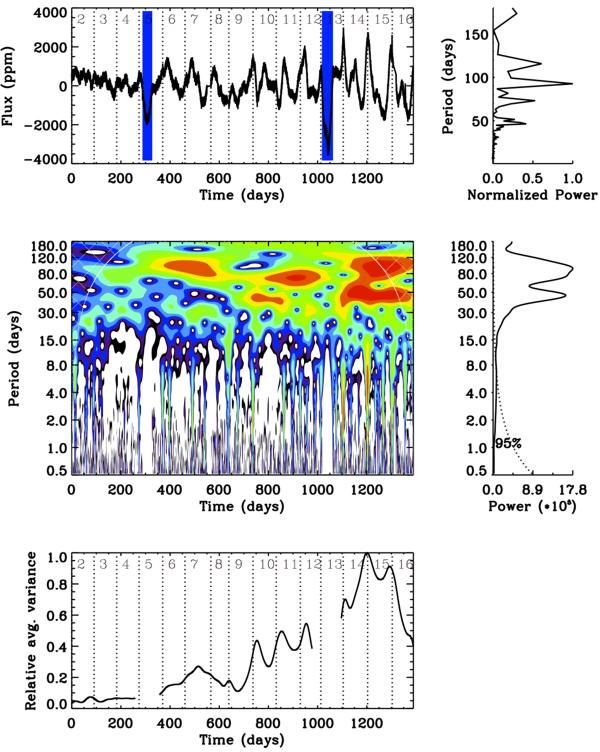
Time-frequency analysis of KIC 8561221. Top left panel: long-cadence light curve starting on June 20, 2009 where dotted lines indicate the transitions between the observing quarters. Top right panel: associated power density spectrum expressed in periods between 0.5 and 180 days. The blue shaded regions were removed in the analysis. Middle left panel: wavelet power spectrum computed using a Morlet wavelet between 0.5 and 180 days on a logarithmic scale. Middle right panel: GPS as a function of the period of the wavelet. The dotted line is the confidence level corresponding to a 95% probability. Bottom panel: the scale-averaged time series reconstructed from the periods in the range 15 to 150 days. The discontinuities at Q5 and Q13 are a consequence of the rejected regions (enlarged to avoid border effects).
Current usage metrics show cumulative count of Article Views (full-text article views including HTML views, PDF and ePub downloads, according to the available data) and Abstracts Views on Vision4Press platform.
Data correspond to usage on the plateform after 2015. The current usage metrics is available 48-96 hours after online publication and is updated daily on week days.
Initial download of the metrics may take a while.