Free Access
Fig. 3
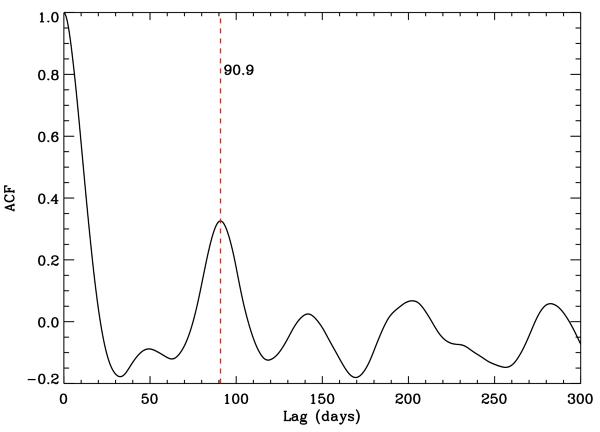
Autocorrelation function (ACF) of the light curve shown in the top left-hand panel of Fig. 2. The maximum of the ACF caused by rotation is marked by a vertical red dashed line (90.9 ± 11.7 days).
Current usage metrics show cumulative count of Article Views (full-text article views including HTML views, PDF and ePub downloads, according to the available data) and Abstracts Views on Vision4Press platform.
Data correspond to usage on the plateform after 2015. The current usage metrics is available 48-96 hours after online publication and is updated daily on week days.
Initial download of the metrics may take a while.