Fig. 4
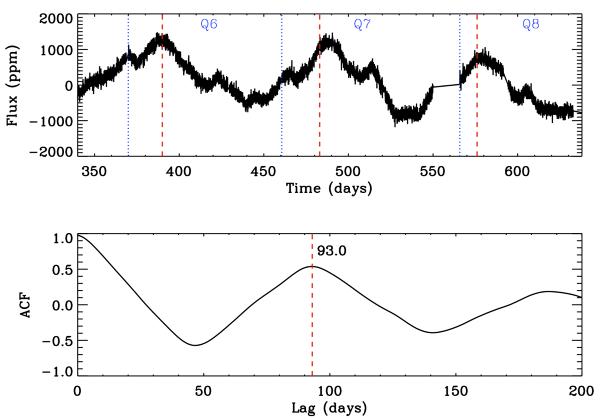
Zoom of the light curve of KIC 8561221 (top) and ACF of this part of the light curve. The position of maximum of the ACF, 93.0 days, is marked by a vertical red dashed line in the bottom panel. The red-dashed lines in the light curve (top panel) are the corresponding period intervals, which match the repeating flux modulations. The ends of each quarter are indicated by the blue dotted lines.
Current usage metrics show cumulative count of Article Views (full-text article views including HTML views, PDF and ePub downloads, according to the available data) and Abstracts Views on Vision4Press platform.
Data correspond to usage on the plateform after 2015. The current usage metrics is available 48-96 hours after online publication and is updated daily on week days.
Initial download of the metrics may take a while.