Fig. 6
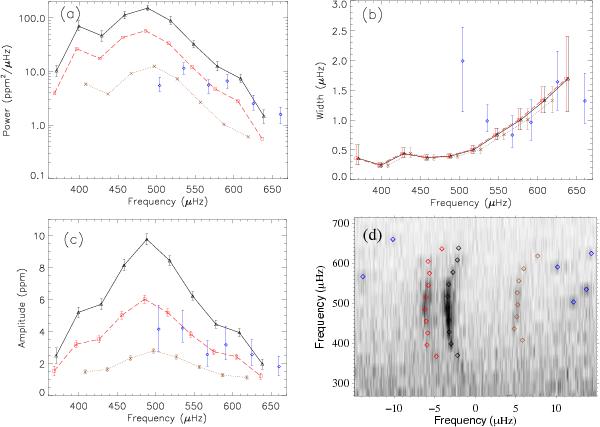
Height, i.e. power a), linewidth b), and amplitude c) of the fitted modes following “case 3”. See the text for further details. Colors correspond to different degrees: ℓ = 0 (black triangles), ℓ = 1 (blue diamonds), ℓ = 2 (red squares), and ℓ = 3 (brown crosses). To indicate that all parameters of the dipole modes were fitted independently, while the amplitude ratios and linewidths of the ℓ = 2 and ℓ = 3 modes were fitted together, the points for the ℓ = 0, 2, and 3 modes are connected by black continuous, red dashed, and brown dotted lines, respectively. Panel d) shows the échelle diagram with the measured frequencies (diamonds) superimposed on the power spectrum (grey scale).
Current usage metrics show cumulative count of Article Views (full-text article views including HTML views, PDF and ePub downloads, according to the available data) and Abstracts Views on Vision4Press platform.
Data correspond to usage on the plateform after 2015. The current usage metrics is available 48-96 hours after online publication and is updated daily on week days.
Initial download of the metrics may take a while.