Fig. 7
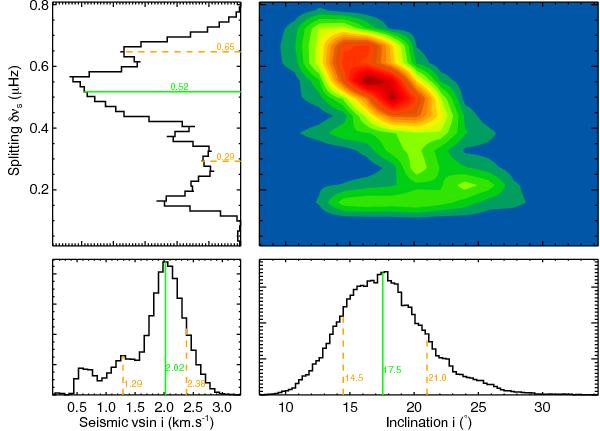
Correlation map between ℓ > 1 splitting and the inclination angle (upper right) for case 3, as well as their probability density function (PDF; upper left, lower right respectively). The seismic vsini (lower left) is derived using the radius and effective temperature of the RADIUS pipeline, and the p-mode splitting shown in the top-right panel. The solid green lines correspond to the median of the distributions and the orange dashed lines indicate the 68% confidence interval.
Current usage metrics show cumulative count of Article Views (full-text article views including HTML views, PDF and ePub downloads, according to the available data) and Abstracts Views on Vision4Press platform.
Data correspond to usage on the plateform after 2015. The current usage metrics is available 48-96 hours after online publication and is updated daily on week days.
Initial download of the metrics may take a while.