Fig. 4
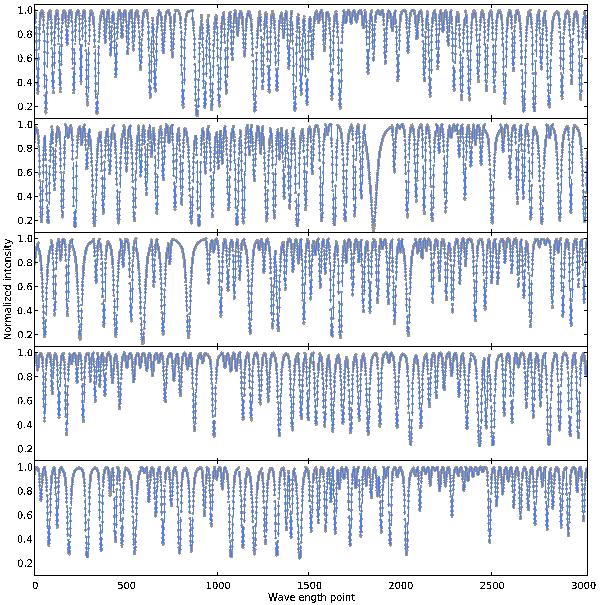
Observed spectral lines in the optical (dots), together with the MAP fit (blue curve). The selected spectral lines are ordered by wavelength. The abscissa refers to the sampling of the FTS atlas. The MAP fit does a very good job, demonstrating that the simplified Milne-Eddington model that we propose to explain the observations is quite accurate.
Current usage metrics show cumulative count of Article Views (full-text article views including HTML views, PDF and ePub downloads, according to the available data) and Abstracts Views on Vision4Press platform.
Data correspond to usage on the plateform after 2015. The current usage metrics is available 48-96 hours after online publication and is updated daily on week days.
Initial download of the metrics may take a while.