Fig. 1
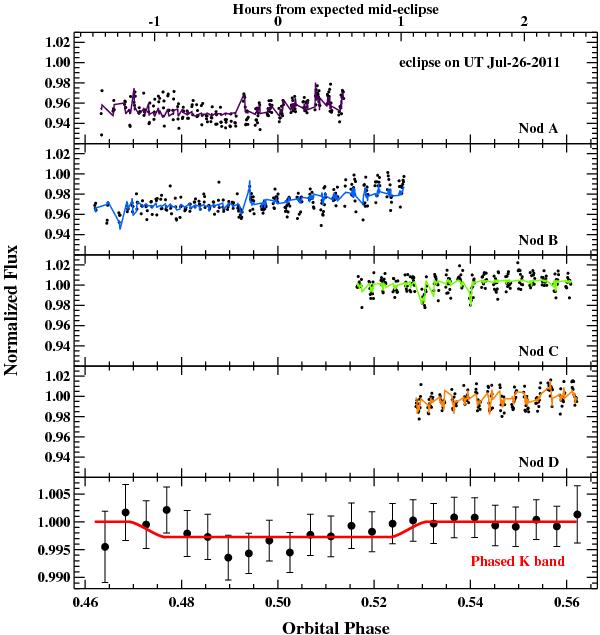
K-band occultation light-curve of WASP-5 observed on UT July 26 2011 (in nodding mode). As described in the text, instrumental crashes led to four groups of nods, none of which covered the whole eclipse. The top four panels show the raw light-curve for each nod, overplotted with the best-fit model. Bottom panel shows the phase-folded K-band light curve, which has been corrected for baseline trend and binned every 10 minutes for display purposes.
Current usage metrics show cumulative count of Article Views (full-text article views including HTML views, PDF and ePub downloads, according to the available data) and Abstracts Views on Vision4Press platform.
Data correspond to usage on the plateform after 2015. The current usage metrics is available 48-96 hours after online publication and is updated daily on week days.
Initial download of the metrics may take a while.