Fig. 2
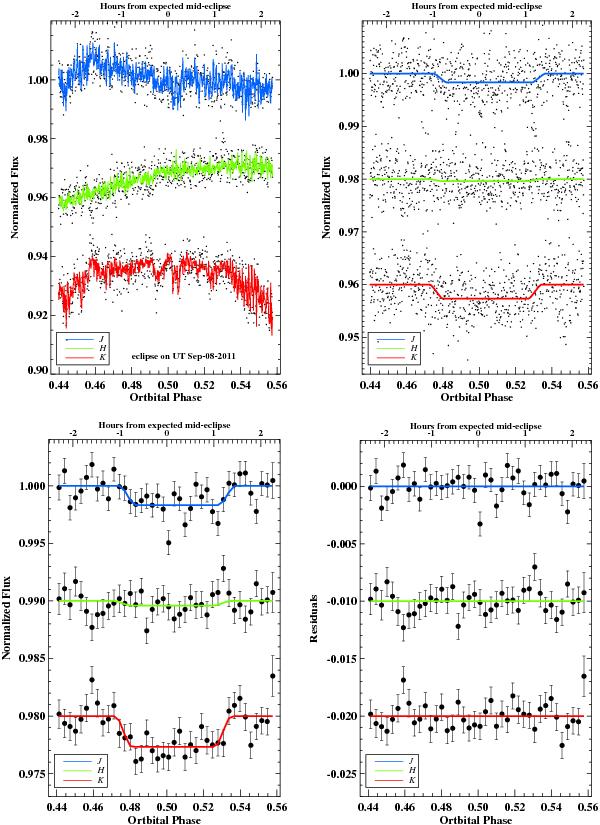
Near-infrared occultation light-curves of WASP-5 observed on UT Sep 08 2011 (in staring mode). Each panel from top to bottom shows for the J, H and K bands. Top left: raw light-curves overplotted with the best-fit models, which consist of a theoretical light-curve multiplied with a decorrelation function. Top right: light curves after baseline correction. Bottom left: light curves binned every seven minutes for display purposes. Bottom right: residuals of light-curve fitting.
Current usage metrics show cumulative count of Article Views (full-text article views including HTML views, PDF and ePub downloads, according to the available data) and Abstracts Views on Vision4Press platform.
Data correspond to usage on the plateform after 2015. The current usage metrics is available 48-96 hours after online publication and is updated daily on week days.
Initial download of the metrics may take a while.