Fig. 4
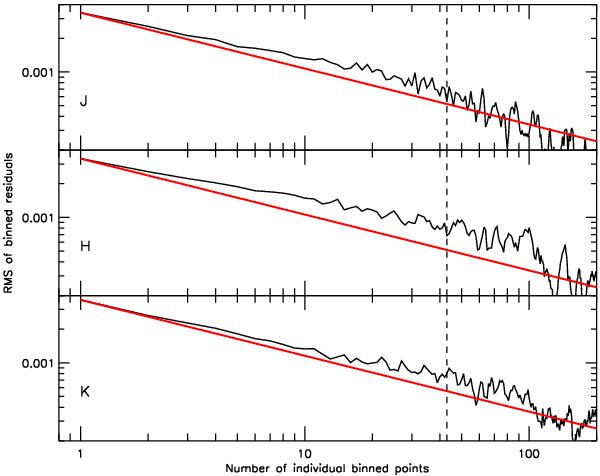
rms of the binned residuals v.s. bin size for the J, H and K occultation
light-curves. The red lines shows the prediction for Gaussian white noise
( ).
The vertical dashed line show the corresponding ingress/egress duration time. We can
still see the strong effect of correlated noise in all three bands even after the
baseline correction.
).
The vertical dashed line show the corresponding ingress/egress duration time. We can
still see the strong effect of correlated noise in all three bands even after the
baseline correction.
Current usage metrics show cumulative count of Article Views (full-text article views including HTML views, PDF and ePub downloads, according to the available data) and Abstracts Views on Vision4Press platform.
Data correspond to usage on the plateform after 2015. The current usage metrics is available 48-96 hours after online publication and is updated daily on week days.
Initial download of the metrics may take a while.