Fig. 5
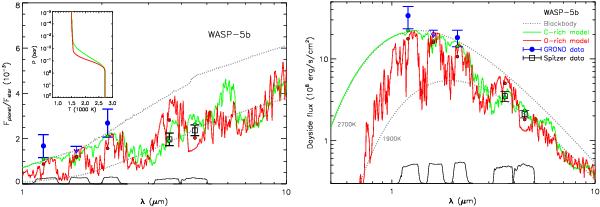
Dayside thermal emission spectrum from the hot Jupiter WASP-5b in terms of planet-to-star flux ratios (left) and planetary dayside flux (right). The blue circles with error bars at 1.26 μm and 2.15 μm and the upper-limit at 1.65 μm, show our measured planet-star flux ratios in the photometric J, H, and K bands. The Spitzer photometric observations reported by Baskin et al. (2013) are shown at 3.6 μm and 4.5 μm (black squares). The dotted gray curves show two planetary blackbody spectra with temperatures of 1900 K and 2700 K. While our J, H, K band data can be fit with a ~2700 K blackbody spectrum, the Spitzer data is consistent with a ~1900 K blackbody. The red and green curves show two model spectra of the dayside atmosphere of WASP-5b with oxygen-rich and carbon-rich compositions, respectively. The inset shows the corresponding pressure-temperature profiles without thermal inversions; a thermal inversion in the dayside atmosphere of WASP-5b is ruled out by the data. An oxygen-rich model is unable to explain all the data. On the other hand, while a carbon-rich model provides a good fit to the data, it radiates 70% more energy than the incident irradiation, which may be unphysical unless there are additional absorbing species in the atmosphere that are not accounted for in the current C-rich model. See Sect. 4.4 for discussion.
Current usage metrics show cumulative count of Article Views (full-text article views including HTML views, PDF and ePub downloads, according to the available data) and Abstracts Views on Vision4Press platform.
Data correspond to usage on the plateform after 2015. The current usage metrics is available 48-96 hours after online publication and is updated daily on week days.
Initial download of the metrics may take a while.