Free Access
Fig. 5
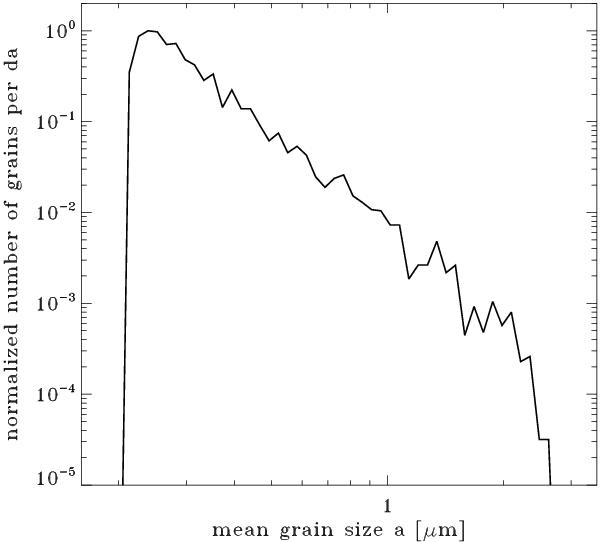
Normalized size distribution per size interval as a function of the mean grain size. The distribution was obtained allowing growth at all cells according to the local density following the Oea09 calculations and finally mixing all grains to a constant size distribution.
Current usage metrics show cumulative count of Article Views (full-text article views including HTML views, PDF and ePub downloads, according to the available data) and Abstracts Views on Vision4Press platform.
Data correspond to usage on the plateform after 2015. The current usage metrics is available 48-96 hours after online publication and is updated daily on week days.
Initial download of the metrics may take a while.