Fig. 6
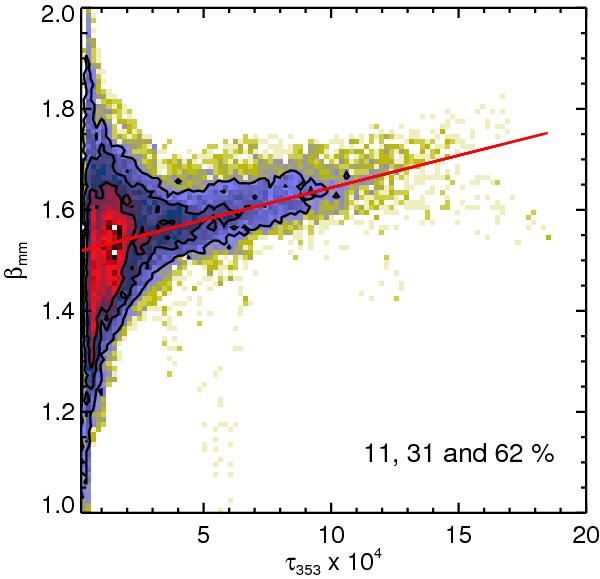
Distribution of βmm as a function of τ353, for the whole region. The red line gives the best linear fit for τ353 ≥ 4 × 10⁻⁴ (see text). The colour scale is logarithmic and it represents the density of points. The three contours show the densities for a cumulated fraction of 11, 31, and 62% of the data points, from red to yellow.
Current usage metrics show cumulative count of Article Views (full-text article views including HTML views, PDF and ePub downloads, according to the available data) and Abstracts Views on Vision4Press platform.
Data correspond to usage on the plateform after 2015. The current usage metrics is available 48-96 hours after online publication and is updated daily on week days.
Initial download of the metrics may take a while.