Fig. 6
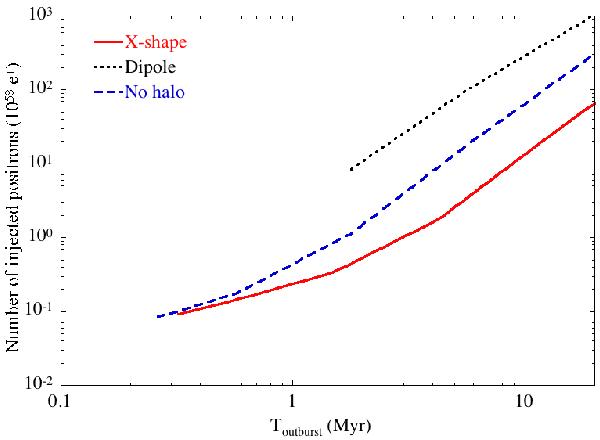
Number of positrons injected at the outburst in the CMZ, which makes it possible to reproduce a 511 keV flux of 5 × 10⁻⁴ ph cm-2 s-1 outside the CMZ (R> 200 pc) today, as a function of time since outburst. The curves are shown only over the time intervals when the flux inside the CMZ (R< 200 pc) is below the observed 1.5 × 10⁻⁴ ph cm-2 s-1 (hence the truncations of the left parts). The solid red, dotted black, and dashed blue curves correspond to the simulations carried out with a X-shaped, dipole, and no halo GMF configurations.
Current usage metrics show cumulative count of Article Views (full-text article views including HTML views, PDF and ePub downloads, according to the available data) and Abstracts Views on Vision4Press platform.
Data correspond to usage on the plateform after 2015. The current usage metrics is available 48-96 hours after online publication and is updated daily on week days.
Initial download of the metrics may take a while.