Fig. 1
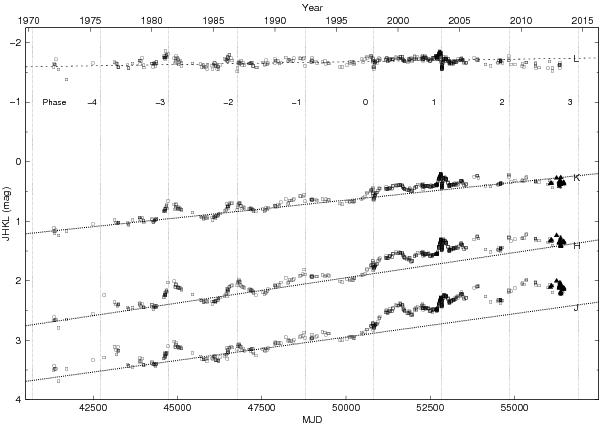
JHKL light curves from 1972–2013 (open squares: Mk II, filled triangles: SIRIUS). The errors at JHK are less than ± 0.03 mag, while those at L are about ± 0.05 mag. Dotted lines show linear regression trends based on the pre-1998 data. Vertical dotted lines indicate periastron passages (the corresponding phases are indicated). In J, H, and to a lesser degree in K and L, η Car did not follow the long-term linear brightening trends after the 1998 periastron passage.
Current usage metrics show cumulative count of Article Views (full-text article views including HTML views, PDF and ePub downloads, according to the available data) and Abstracts Views on Vision4Press platform.
Data correspond to usage on the plateform after 2015. The current usage metrics is available 48-96 hours after online publication and is updated daily on week days.
Initial download of the metrics may take a while.