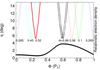
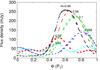
Fig. 4
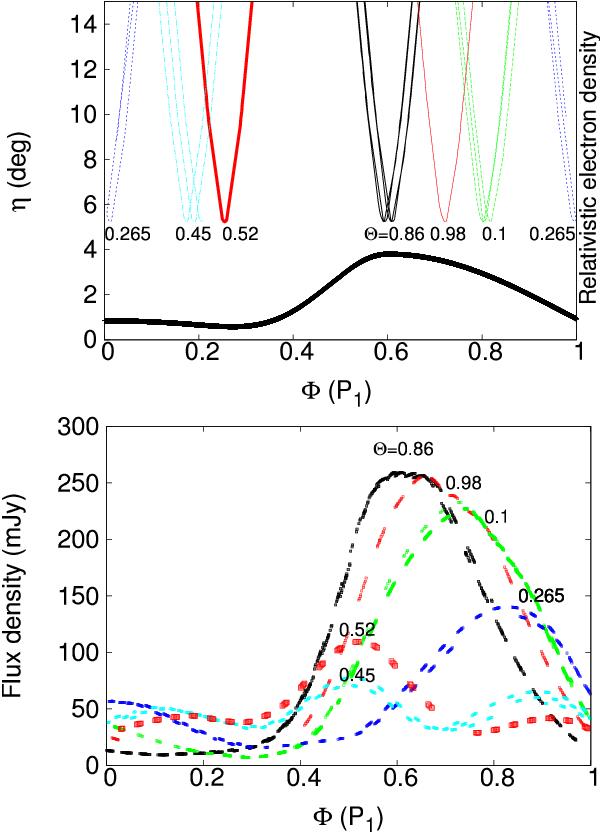
Top: angle η between jet axis and line of sight at different phases of the long-term modulation (Θ) vs. orbital phase (Φ). One sees as the minimum of η, which corresponds to maximum Doppler boosting, moves at different Φs for the different Θ phases. The black thick curve is (on an arbitrary scale) the adopted relativistic electron density function of P1 of Sect. 2.4. Bottom: amplitude modulation and orbital shift of the outbursts: outbursts at different Θs vs. Φ (with the same colour code as the above panel). The outburst decreases its amplitude and shifts in orbital phase.
Current usage metrics show cumulative count of Article Views (full-text article views including HTML views, PDF and ePub downloads, according to the available data) and Abstracts Views on Vision4Press platform.
Data correspond to usage on the plateform after 2015. The current usage metrics is available 48-96 hours after online publication and is updated daily on week days.
Initial download of the metrics may take a while.