Fig. 7
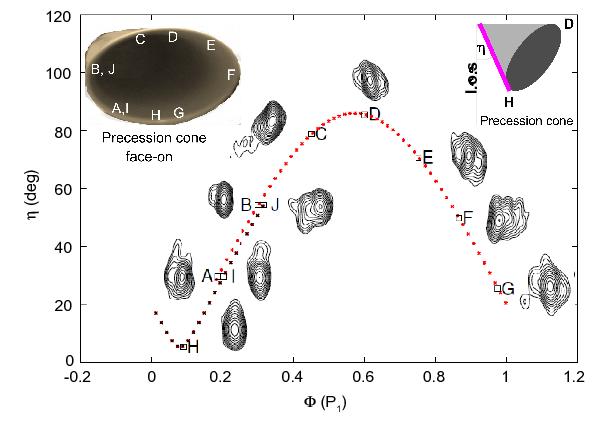
Angle η between the jet axis and the line of sight at the epochs of the VLBA runs A-J. The trend of η vs. Φ(P1) is shown together with the VLBA maps (Massi et al. 2012) (see Sect. 4.5). The VLBA runs cover 30 days, then more than one orbital cycle of 26.49 days; runs I at Φ = 0.203 and J at Φ = 0.316 were performed one cycle later than runs A at Φ = 0.187 and B at Φ = 0.30. The shift of η (corresponding to a shift of the maximum Doppler boosting) is already appreciable in Fig. 7 even after just one P1 cycle; i.e., the two η curves (black and red ones) vs. Φ do not overlap.
Current usage metrics show cumulative count of Article Views (full-text article views including HTML views, PDF and ePub downloads, according to the available data) and Abstracts Views on Vision4Press platform.
Data correspond to usage on the plateform after 2015. The current usage metrics is available 48-96 hours after online publication and is updated daily on week days.
Initial download of the metrics may take a while.