Fig. 1
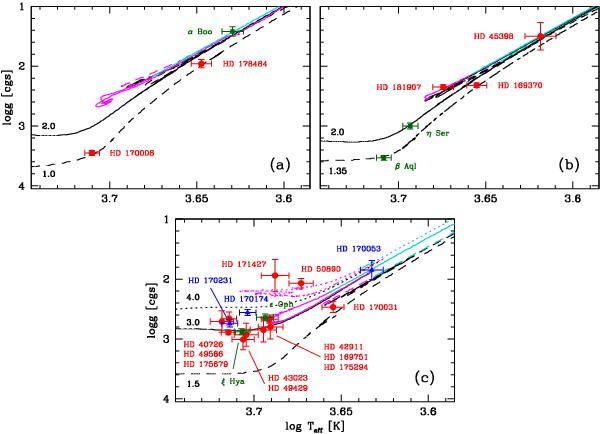
Position of the targets in the log Teff–log g plane (red circles: CoRoT targets, blue triangles: stars in NGC 6633, green squares: benchmark stars). The predictions of evolutionary models, which include rotation-induced mixing (V/Vcrit = 0.45 on the zero-age main sequence; ZAMS) and thermohaline mixing, are overplotted (Lagarde et al. 2012). The initial mass of the models in solar units is indicated to the left of each panel. (The tracks are shown with a different linestyle depending on the mass.) The colour of the track indicates the evolutionary phase: red-giant branch (RGB; black), core-He burning (magenta), and asymptotic-giant branch (AGB; cyan). The data are separated into three metallicity domains: theoretical tracks for [Fe/H] = –0.56 and data for stars with [Fe/H] < –0.26 (panel a)); tracks for [Fe/H] = –0.25 and data for stars with –0.26 ≤ [Fe/H] < –0.12 (panel b)); and tracks at solar metallicity (Z = 0.014) and data for stars with [Fe/H] ≥ –0.12 (panel c)). When available, the stellar parameters are those obtained with the gravity constrained to the seismic value (Sect. 6).
Current usage metrics show cumulative count of Article Views (full-text article views including HTML views, PDF and ePub downloads, according to the available data) and Abstracts Views on Vision4Press platform.
Data correspond to usage on the plateform after 2015. The current usage metrics is available 48-96 hours after online publication and is updated daily on week days.
Initial download of the metrics may take a while.