Fig. 5
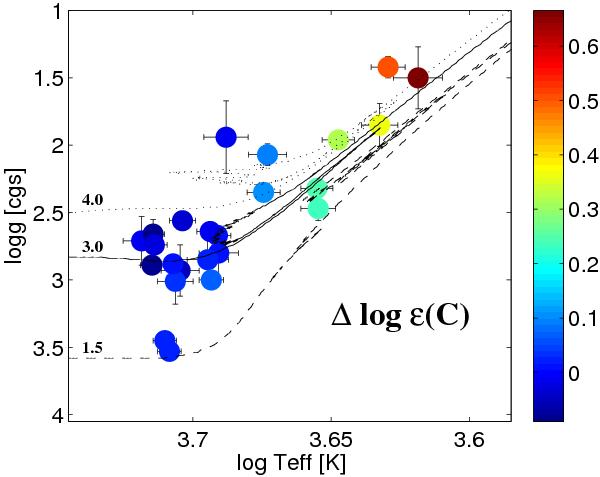
Difference between the abundances yielded by C i λ5380 and the mean values using the C2 features. The predictions of evolutionary models at solar metallicity and for masses of 1.5, 3, and 4 M⊙ are overplotted for illustrative purposes. Same tracks as in Fig. 1, except that the evolutionary phase, is not colour coded.
Current usage metrics show cumulative count of Article Views (full-text article views including HTML views, PDF and ePub downloads, according to the available data) and Abstracts Views on Vision4Press platform.
Data correspond to usage on the plateform after 2015. The current usage metrics is available 48-96 hours after online publication and is updated daily on week days.
Initial download of the metrics may take a while.