Fig. 3
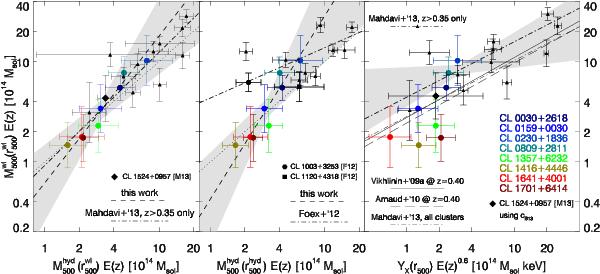
Comparisons with literature data. Left panel: black symbols show
z> 0.35 clusters from
Mahdavi et al. (2013), whose best-fit using
Eq. (5) is shown by the dot-dashed
line. The cluster CL 1524+0957 is indicated by a diamond symbol. Coloured symbols
and the dashed line show the “default”  –
– relation for cB13 as in the lower panel of Fig.
1. Middle panel: the same,
but comparing to Foëx et al. (2012) (black
symbols and dot-dashed line for best fit). X-ray masses are measured within
relation for cB13 as in the lower panel of Fig.
1. Middle panel: the same,
but comparing to Foëx et al. (2012) (black
symbols and dot-dashed line for best fit). X-ray masses are measured within
 .
CL 1003+3253 and CL 1120+4318 are emphasised by special symbols. Right
panel: scaling of lensing masses with the
YX proxy. Black symbols show the
z> 0.35 clusters from
M13, to which the thick, dash-dotted line is the best fit. Shaded regions indicate
the uncertainties to this fit. The thin, dash-dotted line gives the best fit M13
quote for their complete sample, while the thin solid and long-dashed lines mark the
M500–YX
relations by V09a and Arnaud et al. (2010),
respectively, for z =
0.40.
.
CL 1003+3253 and CL 1120+4318 are emphasised by special symbols. Right
panel: scaling of lensing masses with the
YX proxy. Black symbols show the
z> 0.35 clusters from
M13, to which the thick, dash-dotted line is the best fit. Shaded regions indicate
the uncertainties to this fit. The thin, dash-dotted line gives the best fit M13
quote for their complete sample, while the thin solid and long-dashed lines mark the
M500–YX
relations by V09a and Arnaud et al. (2010),
respectively, for z =
0.40.
Current usage metrics show cumulative count of Article Views (full-text article views including HTML views, PDF and ePub downloads, according to the available data) and Abstracts Views on Vision4Press platform.
Data correspond to usage on the plateform after 2015. The current usage metrics is available 48-96 hours after online publication and is updated daily on week days.
Initial download of the metrics may take a while.