Fig. 1
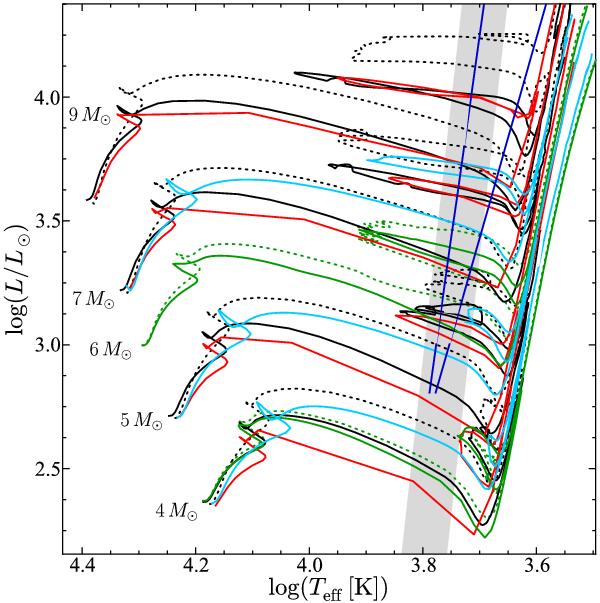
Comparison of Geneva stellar evolutionary tracks (solid black lines: non-rotating; dotted black lines: v/vcrit = 0.4) with Padova tracks (Bertelli et al. 2008, solid cyan lines), and tracks by Castellani et al. (1992, solid red lines) and Lagarde et al. (2012, solid green lines = non-rotating; dotted green lines = v/vcrit = 0.3. The instability strips by Bono et al. (2000b, wedge-shaped dark blue solid lines) and Tammann et al. (2003, gray shaded area) are also included.
Current usage metrics show cumulative count of Article Views (full-text article views including HTML views, PDF and ePub downloads, according to the available data) and Abstracts Views on Vision4Press platform.
Data correspond to usage on the plateform after 2015. The current usage metrics is available 48-96 hours after online publication and is updated daily on week days.
Initial download of the metrics may take a while.