Fig. 12
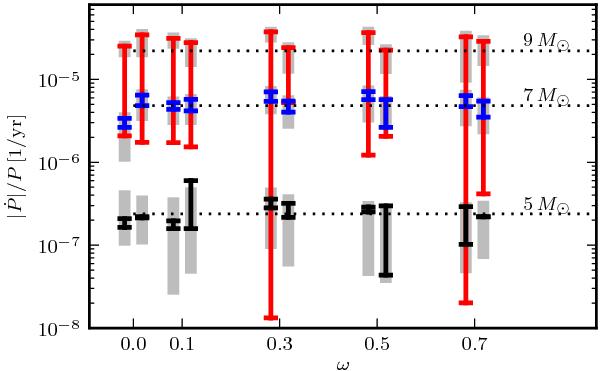
Absolute values of predicted rates of period change for several Cepheid models are shown against initial rotation rate ω. Predictions for the Bono et al. (2000b) IS are drawn as black, blue, and red vertical lines for the 5, 7 and 9 M⊙ models, respectively. Gray shaded bars represent the predictions assuming the Tammann et al. (2003) IS. Second crossing Cepheids are offset to slightly lower ω, third crossing Cepheids to higher ω for visibility. Period decreases along the second crossing, and increases along the third. Per-mass averages are shown as annotated horizontal dotted lines.
Current usage metrics show cumulative count of Article Views (full-text article views including HTML views, PDF and ePub downloads, according to the available data) and Abstracts Views on Vision4Press platform.
Data correspond to usage on the plateform after 2015. The current usage metrics is available 48-96 hours after online publication and is updated daily on week days.
Initial download of the metrics may take a while.