Fig. 2
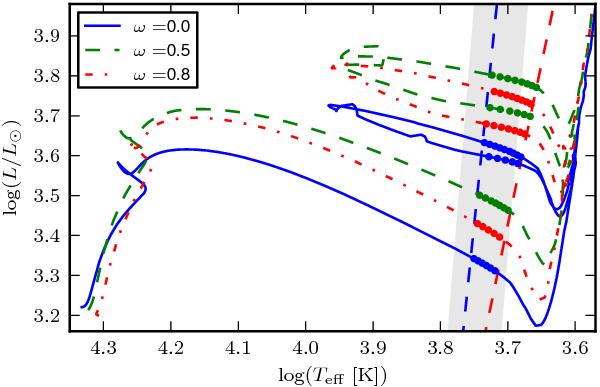
Evolutionary tracks for 7 M⊙ solar-metallicity models with different initial rotation rates: ω = 0.0,0.5,0.8 are drawn as solid blue, dashed green and dash-dotted red lines, respectively. The red and blue edges of the instability strip (IS) according to Bono et al. (2000b) are indicated by dashed lines. Grid points inside the IS are marked as solid circles. The Tammann et al. (2003) IS is shown as a shaded gray area.
Current usage metrics show cumulative count of Article Views (full-text article views including HTML views, PDF and ePub downloads, according to the available data) and Abstracts Views on Vision4Press platform.
Data correspond to usage on the plateform after 2015. The current usage metrics is available 48-96 hours after online publication and is updated daily on week days.
Initial download of the metrics may take a while.