Fig. 3
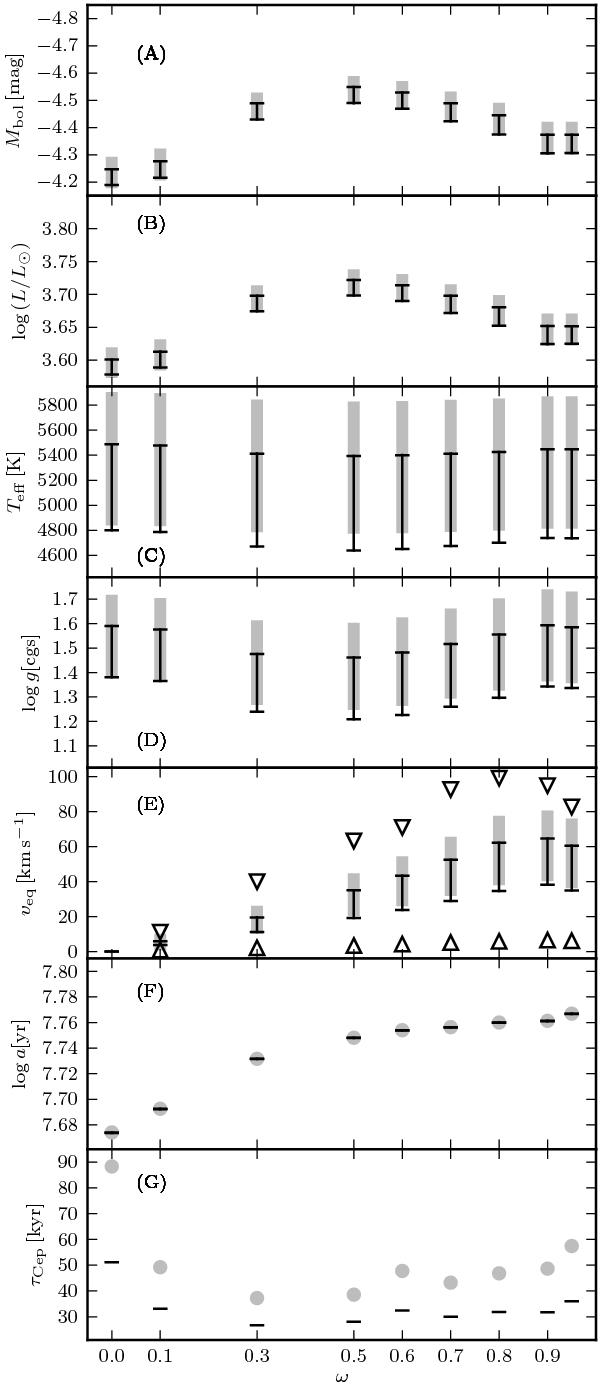
Predictions for 7 M⊙ Cepheids on the second crossing as function of ω. Panels A) through G) show bolometric magnitude, luminosity, effective temperature, surface gravity, equatorial velocity, age, and lifetime. The range of values during the IS crossing is shown as black lines for the IS definition by Bono et al. (2000b), and as a light gray shade for the IS from Tammann et al. (2003). On the second crossing, all parameters increase during the evolution along the blue loop, except for τCep, which shows the duration of the IS crossing. Triangles in panel E) show the extreme values for surface velocity at the beginning of the blue loop near the Hayashi track (minimal) and at its greatest extension (maximal).
Current usage metrics show cumulative count of Article Views (full-text article views including HTML views, PDF and ePub downloads, according to the available data) and Abstracts Views on Vision4Press platform.
Data correspond to usage on the plateform after 2015. The current usage metrics is available 48-96 hours after online publication and is updated daily on week days.
Initial download of the metrics may take a while.