Fig. 5
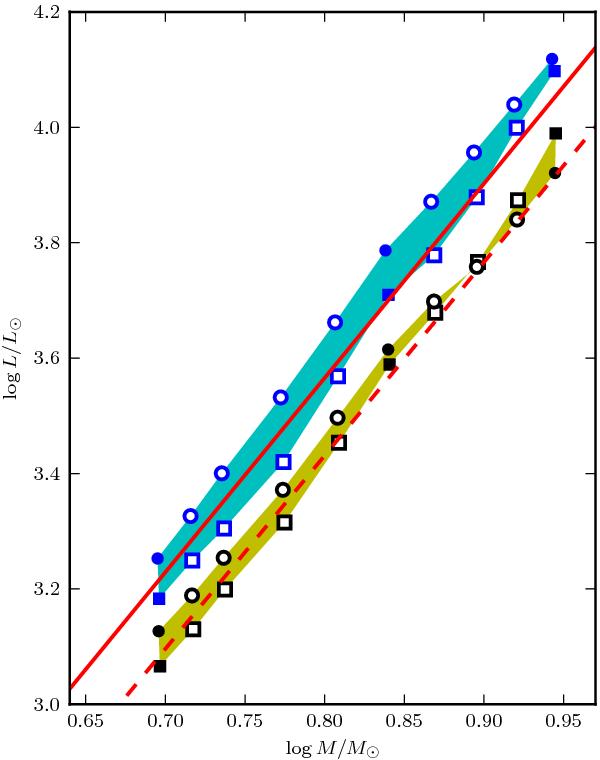
Mass−luminosity relationship for rotating (ω = 0.5, cyan, consistently higher luminosity) and non-rotating Cepheids (yellow, lower luminosity). Shaded areas show the range of values between the second (squares) and third (circles) crossings. Solid symbols are based on grid models, open symbols indicate models obtained via the web-based interpolation tool. The dashed red line that crosses the non-rotating area represents the M − L relation by Caputo et al. (2005, their Eq. (2) with Z = 0.014, Y = 0.27 whose investigation was based on the models by Bono et al. (2000a) and does not account for convective core overshooting. The solid red line crossing through the area delineated by rotating models is the M − L relationship used by Evans et al. (2013), which assumes a value of dover/HP = 0.2 for convective core overshooting (based on models by Prada Moroni et al. 2012).
Current usage metrics show cumulative count of Article Views (full-text article views including HTML views, PDF and ePub downloads, according to the available data) and Abstracts Views on Vision4Press platform.
Data correspond to usage on the plateform after 2015. The current usage metrics is available 48-96 hours after online publication and is updated daily on week days.
Initial download of the metrics may take a while.