Free Access
Fig. 6
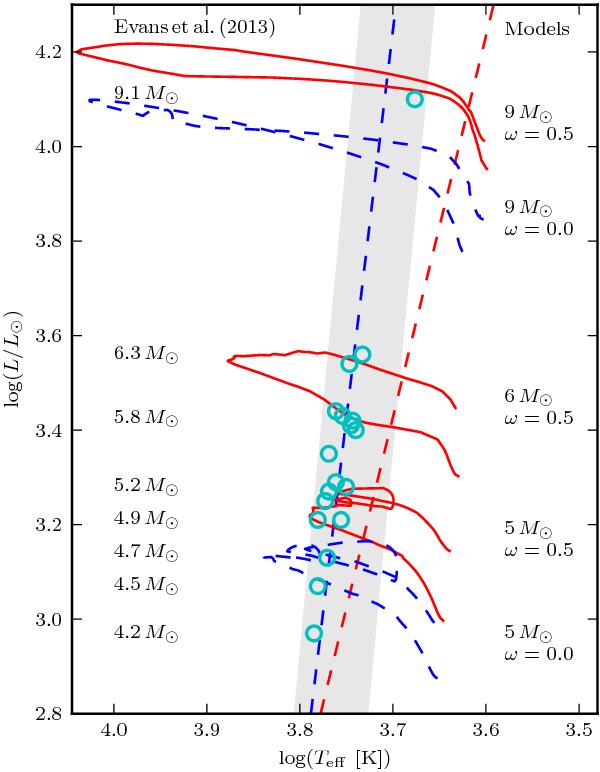
Cepheid with masses determined by Evans et al. (2013) plotted as cyan open circles onto the blue loop portions of evolutionary tracks. Rotating tracks are drawn as solid red, non-rotating ones as dashed blue lines, the IS as in Fig. 2.
Current usage metrics show cumulative count of Article Views (full-text article views including HTML views, PDF and ePub downloads, according to the available data) and Abstracts Views on Vision4Press platform.
Data correspond to usage on the plateform after 2015. The current usage metrics is available 48-96 hours after online publication and is updated daily on week days.
Initial download of the metrics may take a while.