Fig. 8
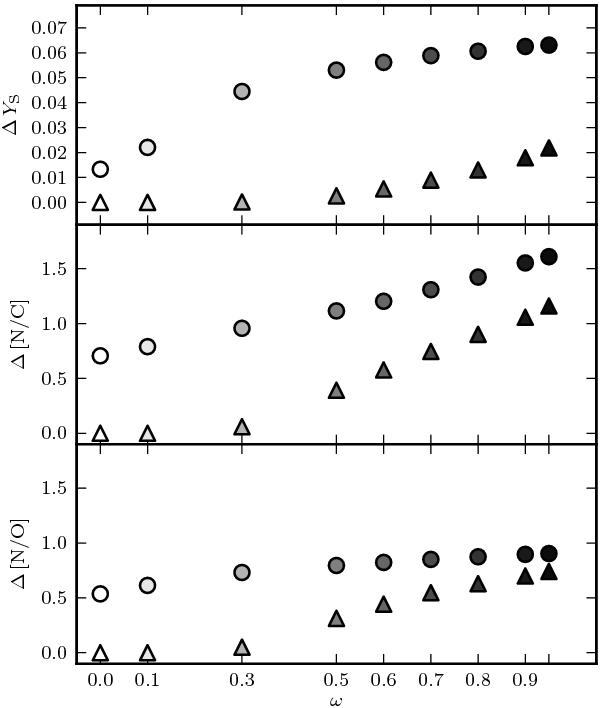
Surface abundance enrichment for the 7 M⊙ model as a function of initial rotation. Top panel shows surface helium mass fraction relative to starting value, center and bottom panels show [N/C] and [N/O] enhancement relative to starting (solar) value. Quantities before first dredge-up are shown as upward triangles, post-dredge-up as circles.
Current usage metrics show cumulative count of Article Views (full-text article views including HTML views, PDF and ePub downloads, according to the available data) and Abstracts Views on Vision4Press platform.
Data correspond to usage on the plateform after 2015. The current usage metrics is available 48-96 hours after online publication and is updated daily on week days.
Initial download of the metrics may take a while.