Fig. 9
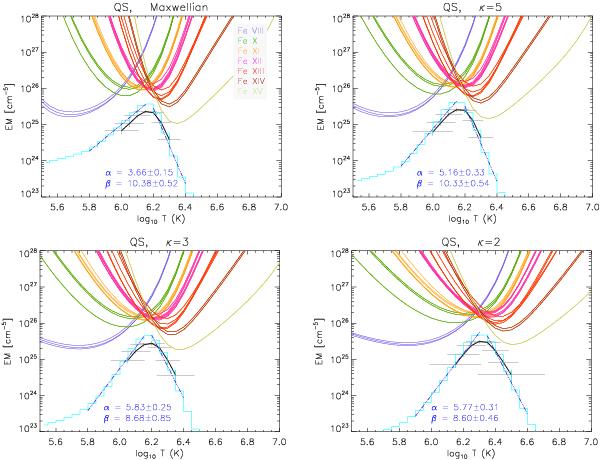
DEM for quiet Sun region using W-S method (light blue line) and the RIM (thick black line). The constant pressure log pe (cm-3 K) = 15 is assumed. The RIM provide vertical and horizontal error bars. The DEM for Maxwellian distribution (top left) and κ-distribution with κ = 5 (top right), κ = 3 (bottom left), κ = 2 (bottom right) is shown. The slope of DEM is indicated by the dark blue linear fit and appropriate power-law indexes (parameter α indicates the slope of increasing DEM peak and β indicates the negative slope of decreasing DEM peak). Correspondent EM-loci curves are also shown, and they are color-coded by ion.

Current usage metrics show cumulative count of Article Views (full-text article views including HTML views, PDF and ePub downloads, according to the available data) and Abstracts Views on Vision4Press platform.
Data correspond to usage on the plateform after 2015. The current usage metrics is available 48-96 hours after online publication and is updated daily on week days.
Initial download of the metrics may take a while.