Fig. 1
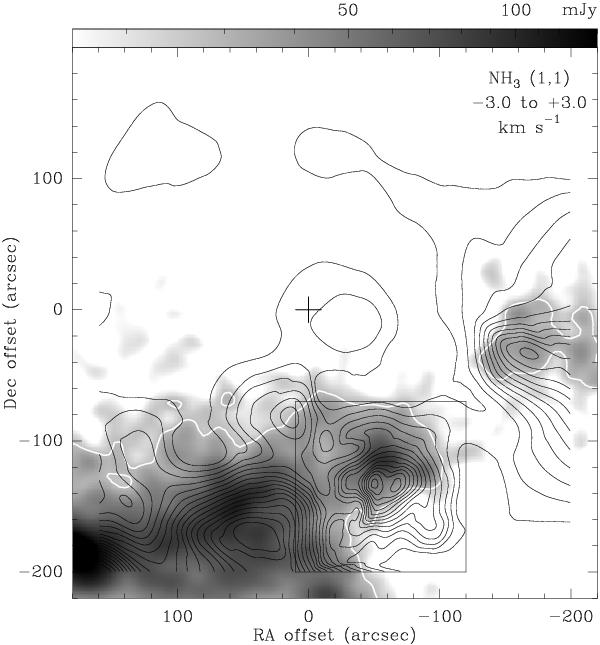
NH3 (1, 1) line intensity map in the direction toward G79.29+0.46. Only the main component has been integrated, in the velocity range indicated at the top right corner. On greyscale, the 1.2 mm continuum image of the MAMBO cameras at the IRAM 30 m telescope is also plotted (Motte et al. 2007). The logarithmic intensity scale used is indicated in the top bar. NH3 starting contours and spacing are 0.2 K km s-1. Equatorial coordinates refer to the star position (Sect. 2). The region was fully sampled within the square indicated at the south-west, and every 40′′elsewhere. The white contour, taken from the MAMBO data, is plotted to indicate the boundaries of the IRDC. Most of the NH3 (1, 1) emission seems associated with the cold dust traced by the 1.2 mm continuum, although some low-level features are also noted (see text).
Current usage metrics show cumulative count of Article Views (full-text article views including HTML views, PDF and ePub downloads, according to the available data) and Abstracts Views on Vision4Press platform.
Data correspond to usage on the plateform after 2015. The current usage metrics is available 48-96 hours after online publication and is updated daily on week days.
Initial download of the metrics may take a while.