Fig. 10
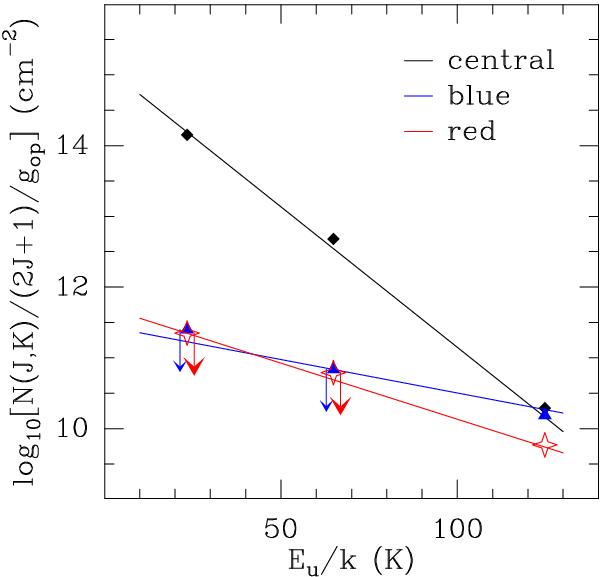
Rotational diagram corresponding to the NH3 peak. The column densities have been computed for the three velocity components depicted in Fig. 5, also indicated in Table 1. The best-fit lines are sketched. The rotational temperature is only determined for the central component, while for the others (blue and red) only lower limits can be derived.
Current usage metrics show cumulative count of Article Views (full-text article views including HTML views, PDF and ePub downloads, according to the available data) and Abstracts Views on Vision4Press platform.
Data correspond to usage on the plateform after 2015. The current usage metrics is available 48-96 hours after online publication and is updated daily on week days.
Initial download of the metrics may take a while.